Tired of doing real math 2 - grad school and coffee consumption
Lately I notice a sharp increase in my coffee consumption (reading Howard Schultz’s Starbucks book, which is actually quite good by the way, does not help either ![]() ). Having recently transitioned into a new PhD program I started wondering whether my increased coffee consumption has something to do with my higher stress levels in the last few weeks, and how that conjecture generalizes to the rest of my grad school experience. To answer that question I decided to take a look at how much money I have spent at coffee houses over the last few years. …Also, I’m right now over-caffeinated at 1:40am and I have nothing better to do anyway.
). Having recently transitioned into a new PhD program I started wondering whether my increased coffee consumption has something to do with my higher stress levels in the last few weeks, and how that conjecture generalizes to the rest of my grad school experience. To answer that question I decided to take a look at how much money I have spent at coffee houses over the last few years. …Also, I’m right now over-caffeinated at 1:40am and I have nothing better to do anyway. ![]()
Luckily, chase.com allows me to download the transaction history of my account as a CSV file (though it’s limited to at most the past two years for some reason). Also luckily, light regex skills in R and the tidyverse packages is all that’s needed to make sense of these data!
Number of transactions per month
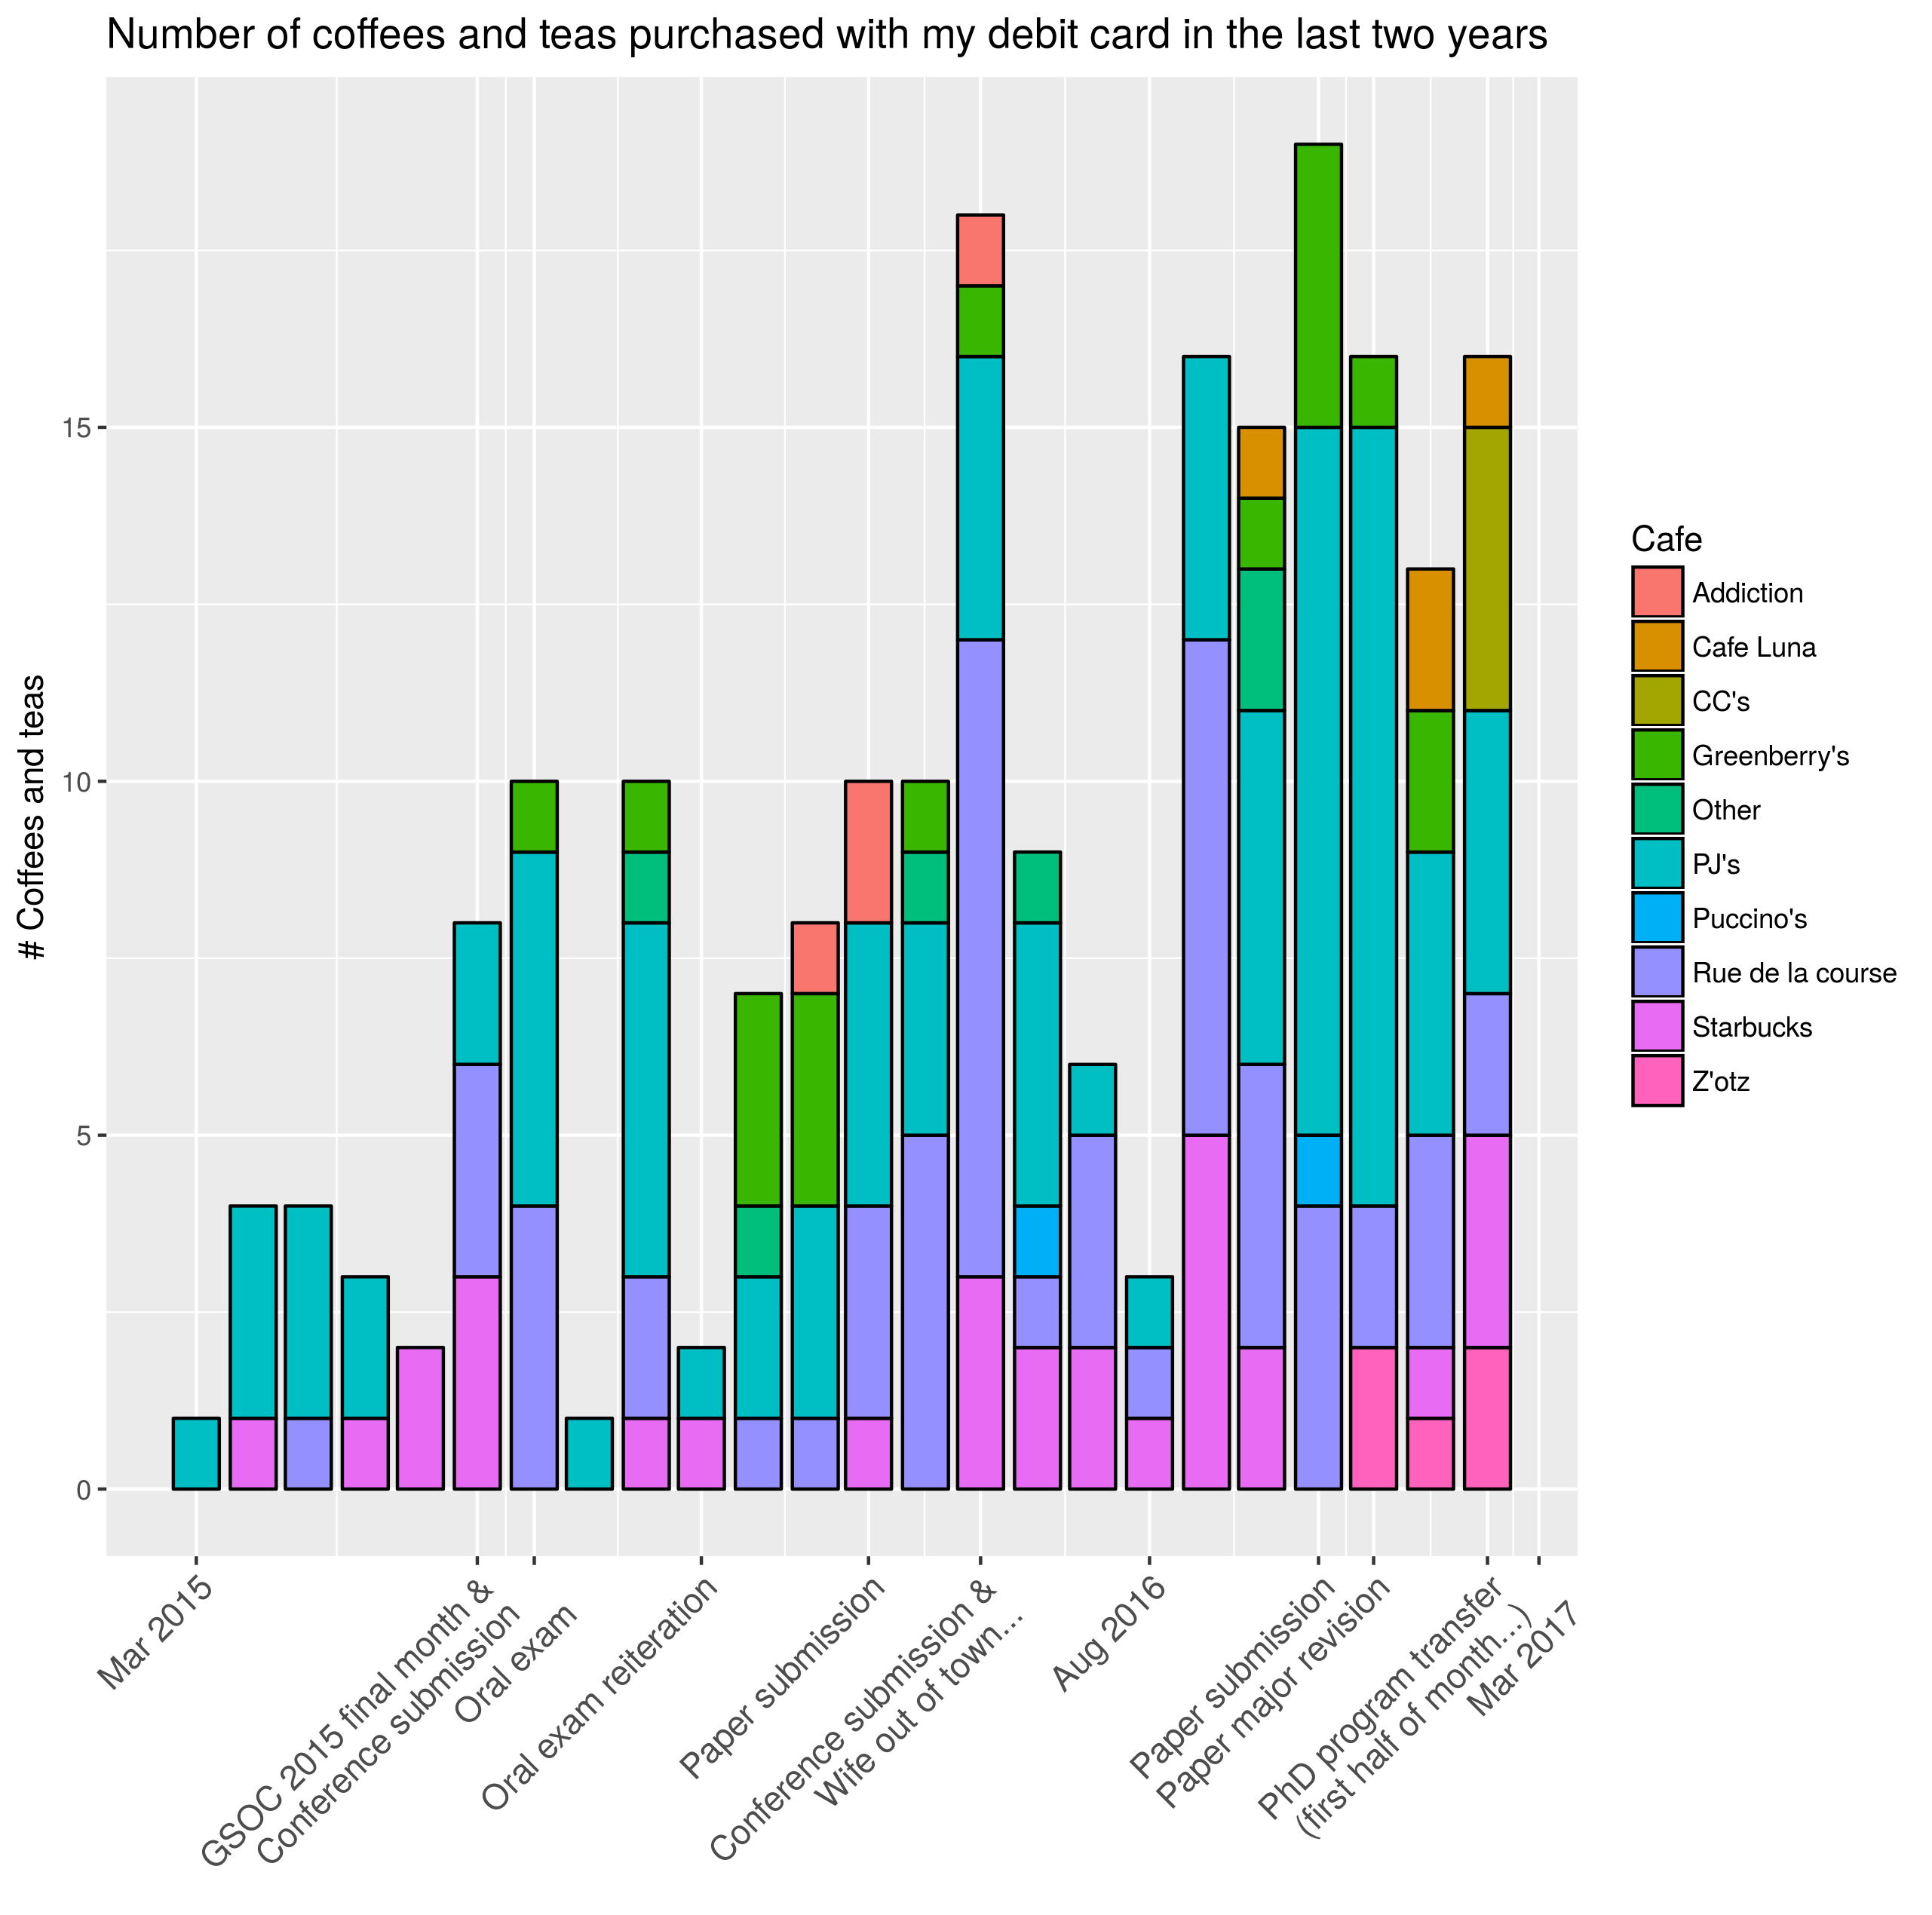
First I take a look at the number of transactions performed with my debit card at New Orleans’ coffee houses between 2/13/2015 and 2/13/2017. On the time axis I mark some major occurrences in my academic life.

Indeed it seems that I frequent coffee places more often at times when I am more stressed, such as those preceding a paper submission or a qualifying exam (or when my wife is out of town for a month ![]() ); and I appreciate some variety with respect to the places where I get coffee or tea.
); and I appreciate some variety with respect to the places where I get coffee or tea.
Yearly statistics
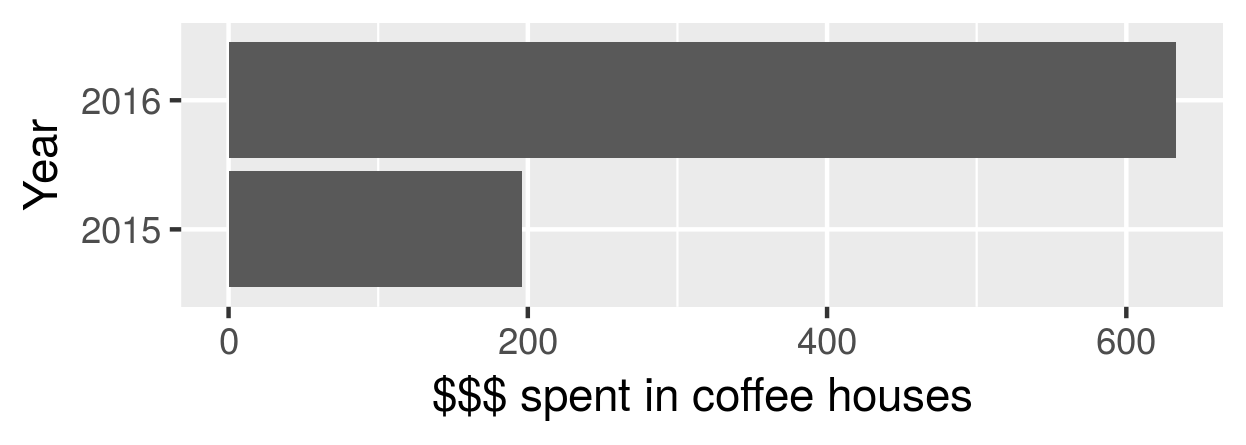
There seems to be a clear increasing trend in the above bar graph. The trend becomes especially clear when I look at how much money I left at coffee places last year compared to the year 2015. There might be a progressing addiction here ![]() …
…

Time series of daily spending
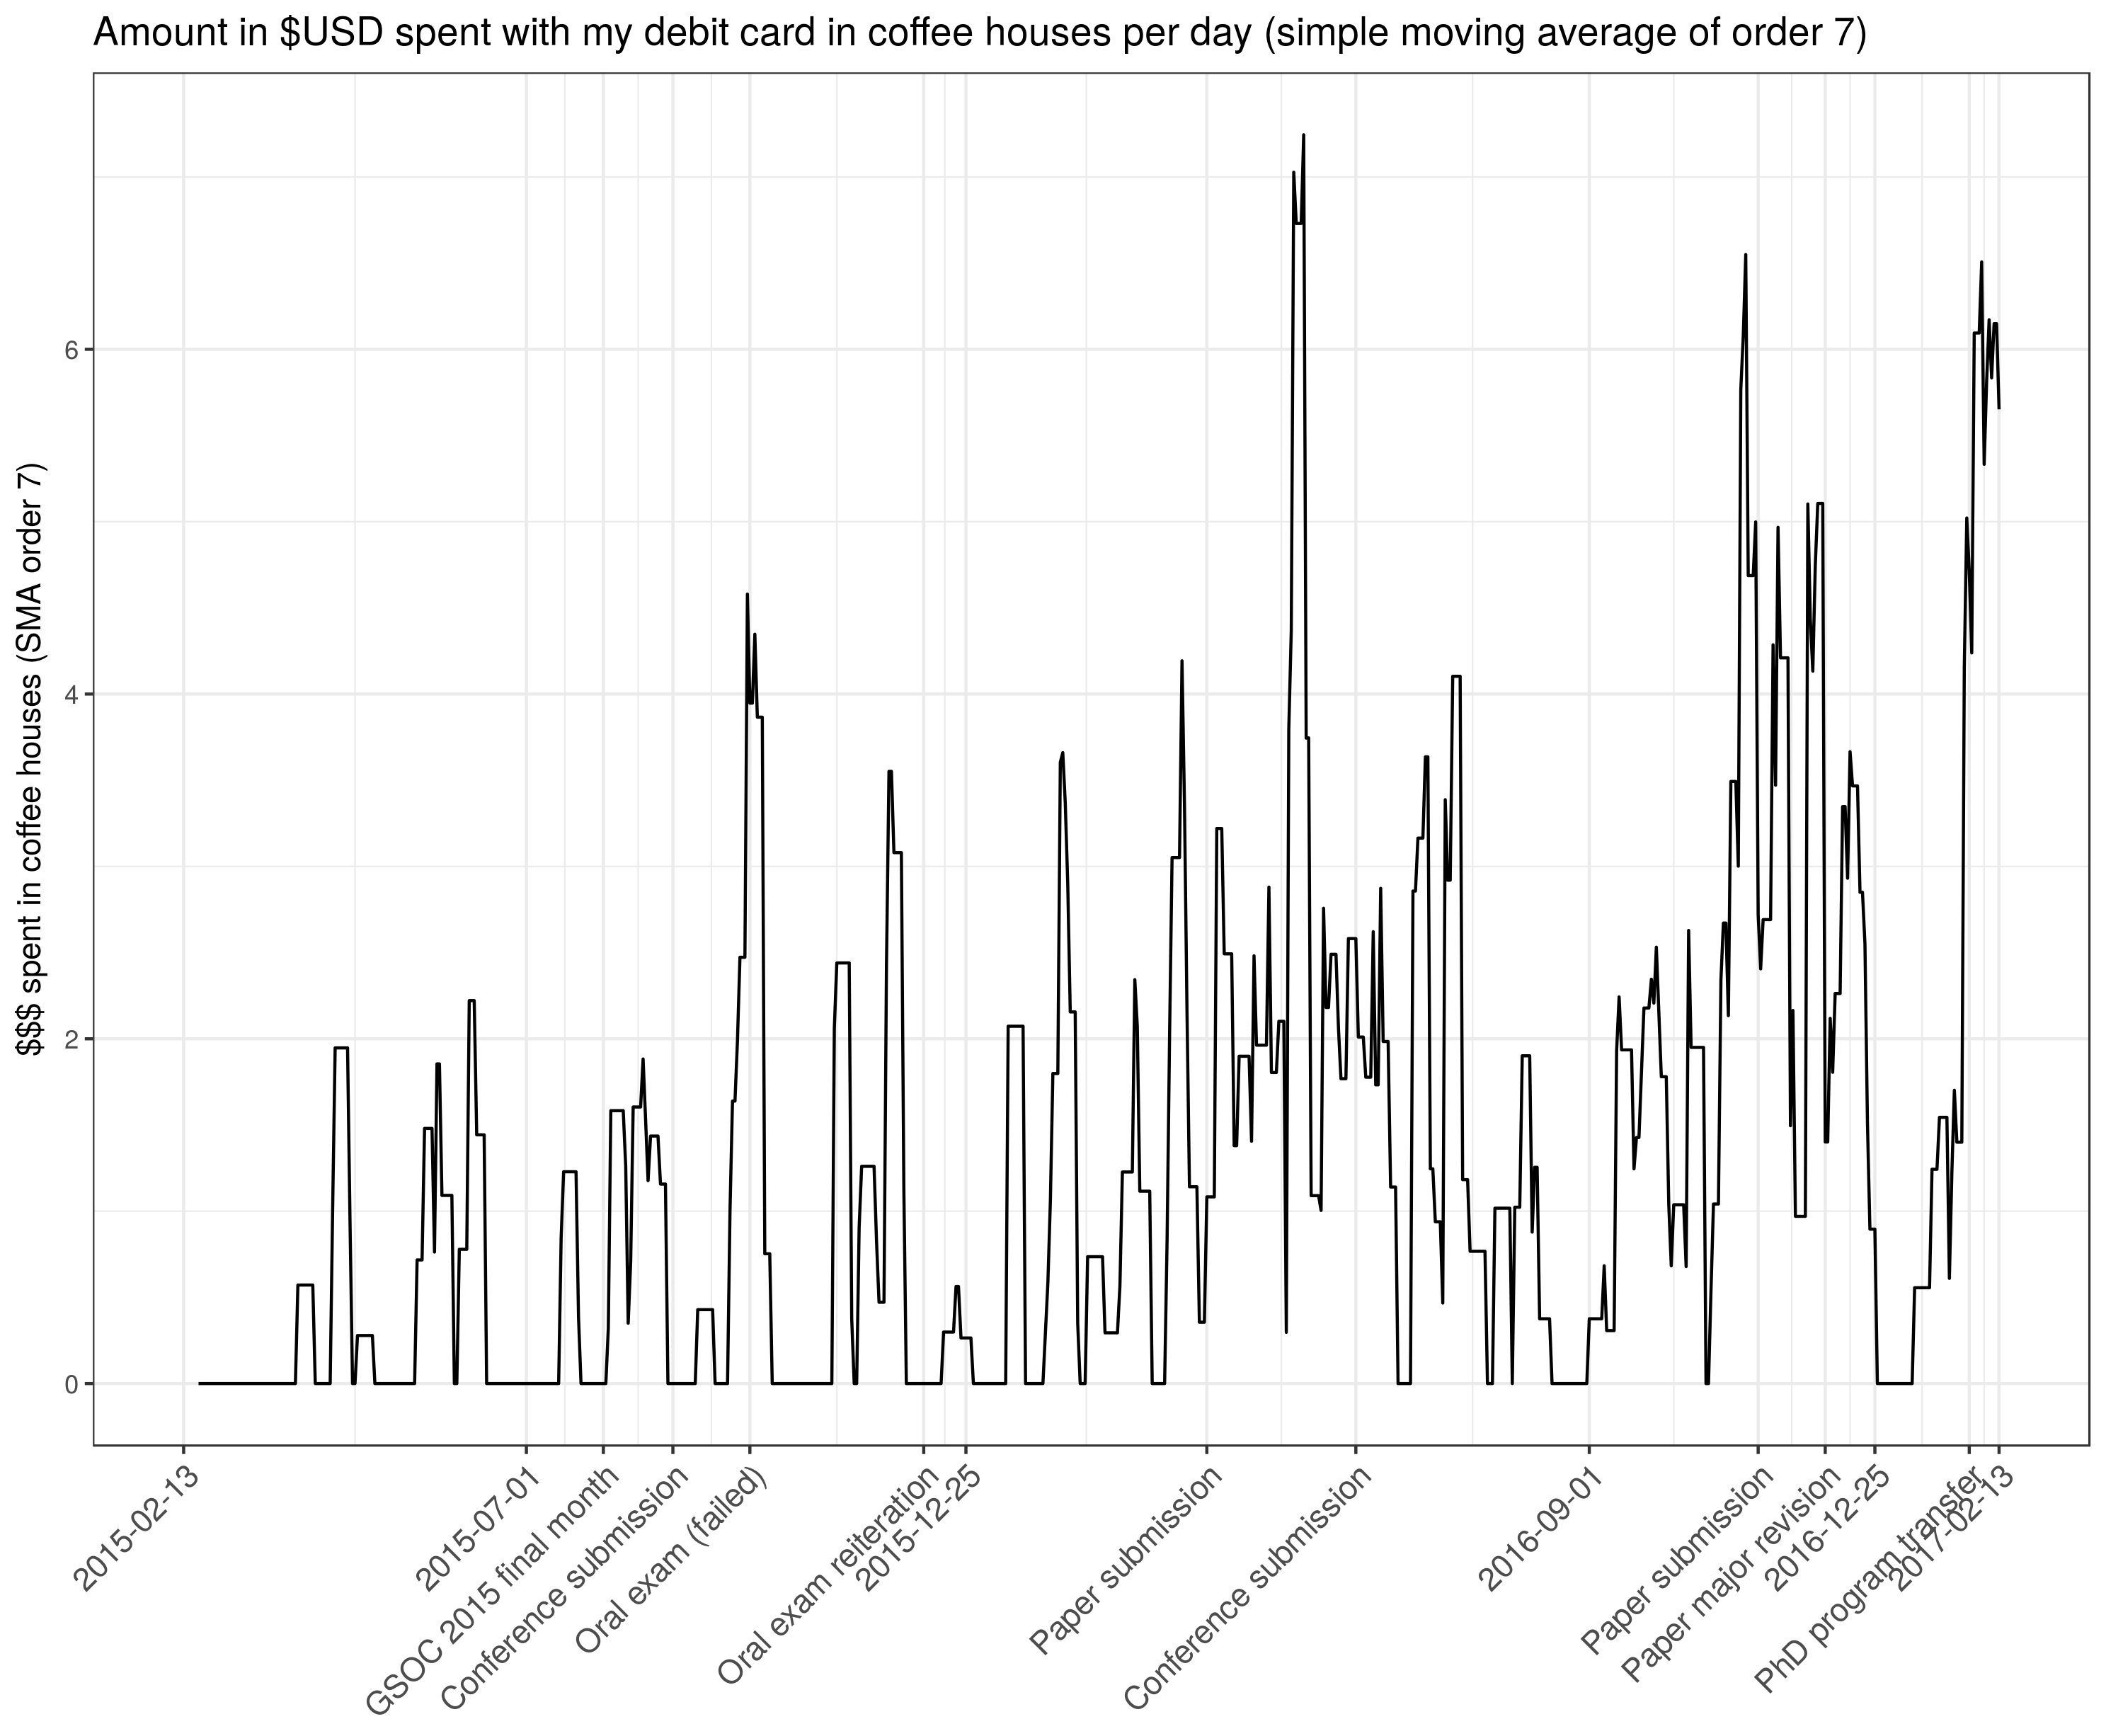
The preceding comparison of the yearly amounts does not reveal anything regarding the relationship of my coffee / tea consumption with my stress levels and events in my academic life. Therefore I generated a time series containing my daily coffee house spendings for the considered two-year period. Below is a visualization of this time series smoothed with a simple moving average of order seven (using the R package TTR).

The finer representation of the data allows some further conclusions:
- It shows a lower coffee consumption during parts of the summer and winter breaks.
- Once again there seems to be a clear association between stressful academic events and an increased coffee (or tea) consumption preceding them.
That’s it. Time to go to bed.
Because I know from a phdcomics cartoon that caffeine combined with a lack of sleep will turn me into a robot rather than into somebody who might eventually finish graduate school…